Hacker proves with Open Data that Microsoft license costs don't matter
(no, not really but…) In December 2014, italian Prime Minister Matteo Renzi annunced soldipubblici.gov.it, a Web portal that provides official Open Data on public spending (“Soldi Pubblici”, that is) in Italy. Within a few hours, an italian Hacker,
[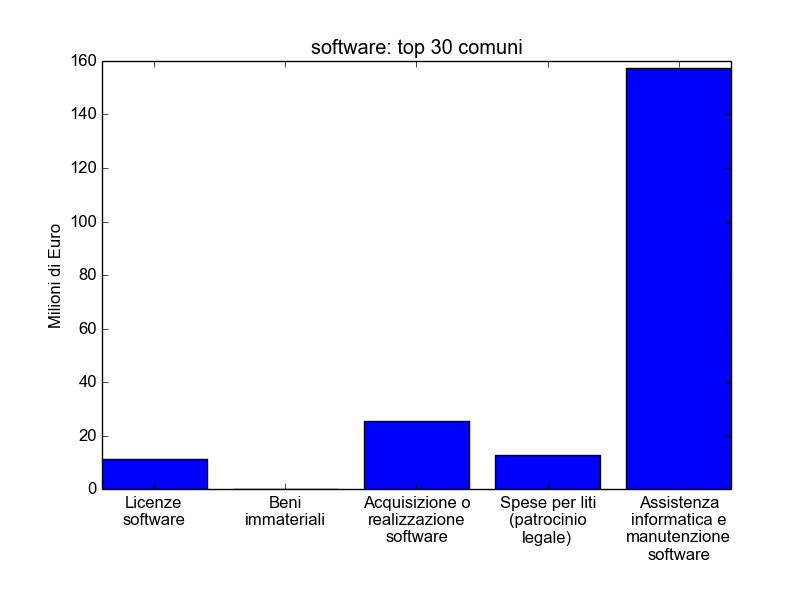
Leonardo Maccari, set up an unofficial blog, that automatically fetches and plots certain categories of data from that portal, making them much easier to understand. I was immediately impressed (see below!) by one of those graphs, the one you can also see here, because:
- goes against one of the arguments used more frequently to promote Free Software (which, in and by itself, is intrinsically weak, and therefore **not **used as the main one by the most experts) that is licensing costs. The graph clearly show that such costs (the leftmost column) are only a small part of the total. From left to right the columns show “software license costs”, “/immaterial goods” (whatever that means…), “software acquisition and development”, “litigation and other legal expenses” (as much as licenses..), “software assistance and maintenance”
- I found very proper, if a bit funny, that such a proof came from Open Data, by a Free/Open Source software hacker
Of course, reality is more complex than that. Both that graph and the underlying raw data are not enough to reach any kind of conclusion. Still, they are a good starting point.
Incidentally, Maccari’s work also proves how bogus is one of the practices and metrics around Open Data, that is the “number of downloads” for this or that dataset. Here we have one single download, or access, that led to a set of easy graph read by many people, none of whom would have ever been able to discover or understand the raw data. So, why bother about download numbers? It only takes one download to get a good result, so open and publish those data already (unless there are other, real obstacles, of course).
Why didn’t I published this immediately? I saw that graph in January 2015. I didn’t put this post online before simply because of lack of time. I have done it now because this is the perfect prelude for another post I’ll publish later this week: the one about an important italian city that migrated from Microsoft Office to OpenOffice a few years ago, and this summer went back to Microsoft. To know how and why, stay tuned!
Who writes this, why, and how to help
I am Marco Fioretti, tech writer and aspiring polymath doing human-digital research and popularization.
I do it because YOUR civil rights and the quality of YOUR life depend every year more on how software is used AROUND you.
To this end, I have already shared more than a million words on this blog, without any paywall or user tracking, and am sharing the next million through a newsletter, also without any paywall.
The more direct support I get, the more I can continue to inform for free parents, teachers, decision makers, and everybody else who should know more stuff like this. You can support me with paid subscriptions to my newsletter, donations via PayPal (mfioretti@nexaima.net) or LiberaPay, or in any of the other ways listed here.THANKS for your support!