When data favour the rich
Lies, damn lies and socioeconomical indicators.
A recent post by Filippo Celata presents a textbook example of how and why data are not neutral and, regardless of their quality, can tell stories very far froom reality if one just accepts them as they are, without further judgment.
On December 31st, 2021 the italian government published the decree that assigns the COVID recovery funds specifically allocated for urban regeneration projects. Celata explains clearly how and why those assignments do not really match local needs.
One indicator to assign them all…
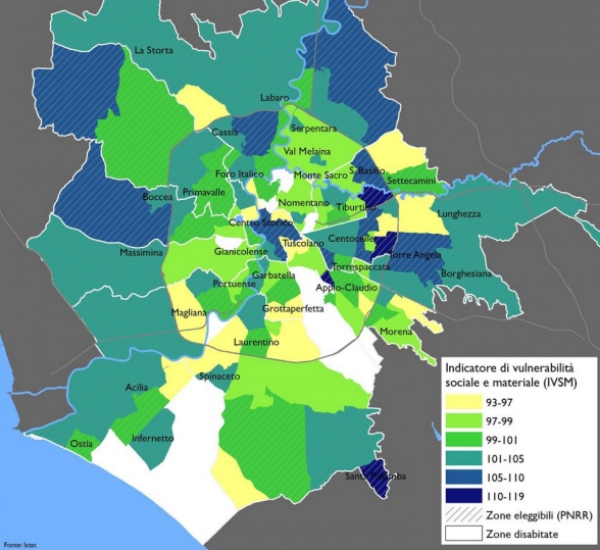
The proposals presented for urban regeneration must have an IVSM value not smaller than 99, with IVSM being an “Indicator of Social and Material Vulnerability”. Celata prepared this map that shows which parts of Rome could receive funding:

And here is the problem with that map: everybody who ever lived in Rome for more than a few months in the last 50 years could immediately tell you that the residents of areas like Parioli, or the very central sectors around Piazza Venezia, Piazza di Spagna or the even more famous Fontana di Trevi have much more means, and much less urgent needs for state-funded regeneration than those of places like Ostia Nord, Corviale or San Basilio. Yet the neighborhoods of the first group got an IVSM value higher than the others, and can then apply to get money. The IVSM, that is, will just send money where there already is much of it.

<u><em><strong>CAPTION:</strong>
<a href="https://en.wikipedia.org/wiki/Trevi_Fountain" target="_blank">Fontana di Trevi,  one of the famously poorest and most neglecteds part of Rome</a>

</em></u>
Why that indicator is misleading
The ISVM is seriously misleading for several reasons. The main ones, that could create the same distortions in any country of the world that allocates funds for local regeneration, would be, according to Celata’s analysis, the importance that it gives to:
- the percentage of young residents “Not in Education, Employment, or Training” (NEET). In Rome, that percentage happens to be much higher in the central areas than in the others. Why? Not clear, but surely not matching reality on the ground. A partial explanation may be that rich young people need to study or work much less than their poorer peers. NEET by choice, not by exclusion, that is.
- families composed only by senior citizens, with one of them more than 80 years old. In the IVSM formula, only such families are counted as needy of assistance. Therefore, central areas mostly populated by seniors look needier than those with lots of single parents with lots of kids, regardless of income
- to keep track of them, many homeless people are registered as residents at the same address of the charities that assist them, which often are in the same central neighborhoods
The list could go on, and some factors are not as easy to spot as the ones that Celata found. But the lesson is clear: sending money to someone only because they scored first on a few quantitative parameters is not a good idea. The devil is in the uncountable, or uncounted details.
Who writes this, why, and how to help
I am Marco Fioretti, tech writer and aspiring polymath doing human-digital research and popularization.
I do it because YOUR civil rights and the quality of YOUR life depend every year more on how software is used AROUND you.
To this end, I have already shared more than a million words on this blog, without any paywall or user tracking, and am sharing the next million through a newsletter, also without any paywall.
The more direct support I get, the more I can continue to inform for free parents, teachers, decision makers, and everybody else who should know more stuff like this. You can support me with paid subscriptions to my newsletter, donations via PayPal (mfioretti@nexaima.net) or LiberaPay, or in any of the other ways listed here.THANKS for your support!