Visualcad is how law should be visualized
Laws should be easy to SEE, and so should their EVOLUTION.
There is no justice if laws are hard to understand, or if it is hard to understand when, how and by whom they changed. Sometimes, the second “understanding” is even more important than the first. This is why I like VisualCad, an online service developed by Giovanni Pirrotta, based on a 2012 project for german laws by Gregor Aisch.
The italian law called Code for Digital Administration (CAD) defines the high level guidelines and framework for everything about digitization, and digitally-driven innovation, in all italian Public Administrations.
CAD has the same problem of all the other laws in Italy, and many other places: it is hard to understand even what the actual, current, COMPLETE law looks like, because the laws that update it, and all the corresponding public announces, only list the single changes (e.g. “sentence X of article Y is abolished, or replaced with this other sentence”). There is no single complete text re-issued at every upgrade as a single document, not for free online, at least. For the same reasons, it is hard to quickly figure out where and how today’s CAD is different from the one of, say, 5 years ago. Since CAD has been updated 29 times since 2005, always in this manner, this is a big problem.
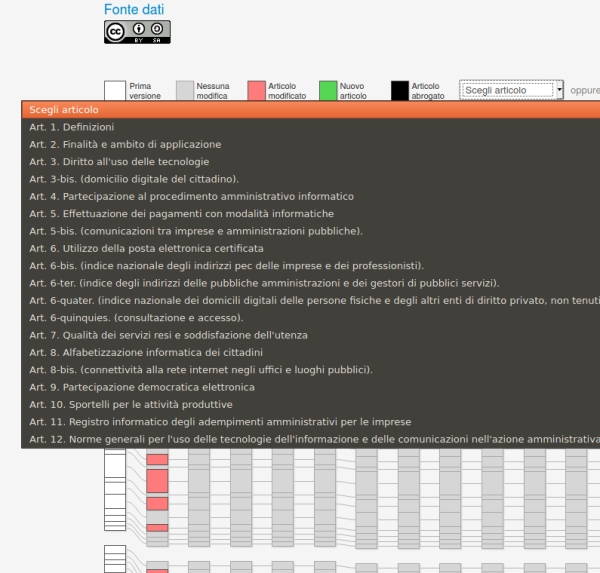
The list of links to all the articles of one version of the CAD

</em></u>
VisualCad is an interactive, online infographic that makes the CAD much easier to study, and follow. Its history, explained in this blog post (Italian) is a happy combination of individual, grassroot initiative and official policies: in 2018, Pirrotta thought it would be useful to be able to merge and compare CAD versions, just like it happens, thanks to tools like Git, Subversion or Mercurial, with software source code. Therefore, he started the arduous task of scraping all the available bits of CAD code he could find online. Luckily, just after he had started, the official Digital Transformation Team then working for the italian government published everything on GitHub, way sooner, and better, than Pirrotta could have realistically done alone: the text were published in reStructuredText format, and linked to the online documentation service readthedocs.io.
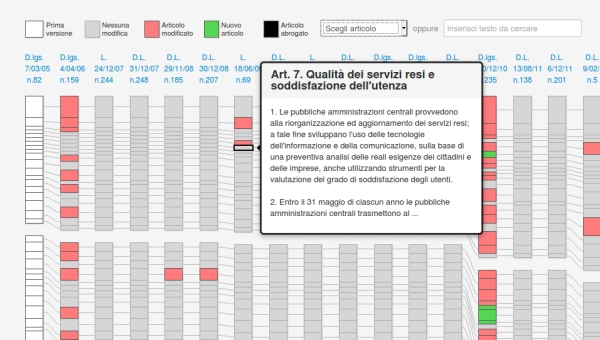
You can read an excerpt of each article, or its full text on GitHug

</em></u>
This made it possible for everybody to compare the several versions of each article directly on GitHub. Therefore, Pirrotta could focus on realizing the interactive map.
The result is easy to understand, and appreciate, even for non-Italian speakers: each column represents one of the 29 versions of CAD issued since 2005, and each cell one CAD article. The color of each cell immediately shows whether that article was changed, extended or outright abolished. When the cursor hovers one article, an excerpt of its text appears, with changes highlighted. Users can view the complete evolution in time of a single article, or search for all the articles that contain some string of text.
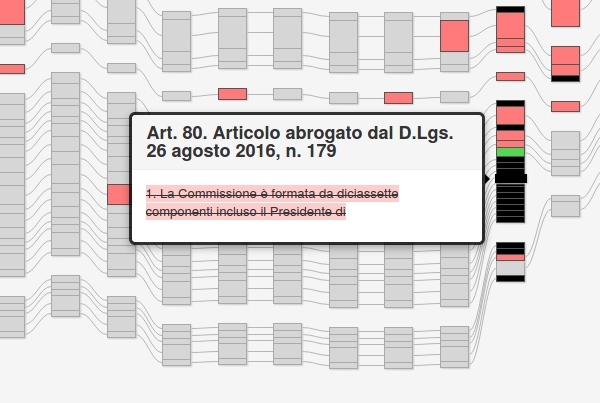
What an abolished law article looks like in VisualCad

</em></u>
VisualCad is a very important service that should be available, and above all widely used, for every law. The first part step to get there, of course, is to manage laws, and lawmaking documentation like software. In Italy, and every other country.
(This post was drafted in March 2020, but only put online in August, because… my coronavirus reports, of course
Who writes this, why, and how to help
I am Marco Fioretti, tech writer and aspiring polymath doing human-digital research and popularization.
I do it because YOUR civil rights and the quality of YOUR life depend every year more on how software is used AROUND you.
To this end, I have already shared more than a million words on this blog, without any paywall or user tracking, and am sharing the next million through a newsletter, also without any paywall.
The more direct support I get, the more I can continue to inform for free parents, teachers, decision makers, and everybody else who should know more stuff like this. You can support me with paid subscriptions to my newsletter, donations via PayPal (mfioretti@nexaima.net) or LiberaPay, or in any of the other ways listed here.THANKS for your support!