Open Data about Budgets and taxes
(this page is part of my Open Data, Open Society report. Please follow that link to reach the introduction and Table of Content, but don’t forget to check the notes to readers!)
Availability in raw, open formats of full budgets of both local governments and of all local public companies (including names and costs of contractors and consultants) as well as that of some tax-related information, can have two very important effects: one is obviously to prevent corruption or simply wastes of public money, spotting any symptom as soon as possible.
Complete transparency of salaries for local administrators in the past years could have also avoided the “statewide outrage” caused by discovering only in 2010, and only through a Los Angeles Times investigation, that most council members of the city of Bell, California, were paid nearly $100,000 per year for part-time jobs. Open Data web services related to financial control can also be built ad-hoc to monitor specific topics, not just whole budgets. This is the spirit with which StimulusWatch.org was built in the USA: “to help the administration keep its pledge to invest stimulus money smartly… by allowing citizens around the country with local knowledge about the stimulus projects in your city, to find, discuss and rate those projects”. Similarly, the NYCStat Stimulus Trackeronly tracks the City’s use of federal stimulus/recovery funds provided through the American Recovery and Reinvestment Act of 2009. The important thing is that if the basic data are open, what to do with them, that is how to select and correlate financial raw data and how to correlate the result, is something that can be decided almost on the spot, without asking any time to the data maintainers to reformat them in any way.
Another important benefit of completely opening financial PSI data is somewhat the opposite of spotting dishonest or incompetent administrators, or preventing them to make mistakes in good or bad faith. Raw, open budget data can help citizens to (re)gain more trust in their administrators, recognizing which ones are doing a good job and supporting them.
A simple application that, looking at official statistics published online, helps UK citizens to understand what their taxes are for is Where did my tax go?, which is based on Public Expenditure Statistical Analyses (PESA) published by HM Treasury. The website consists of a web form in which the user must only enter Gross Income in each of the last seven tax years, current age and sex. The result is diagrams and tables showing total taxes due for each of those years and how much of the total was used for pensions, healthcare, education and other major budget voices.
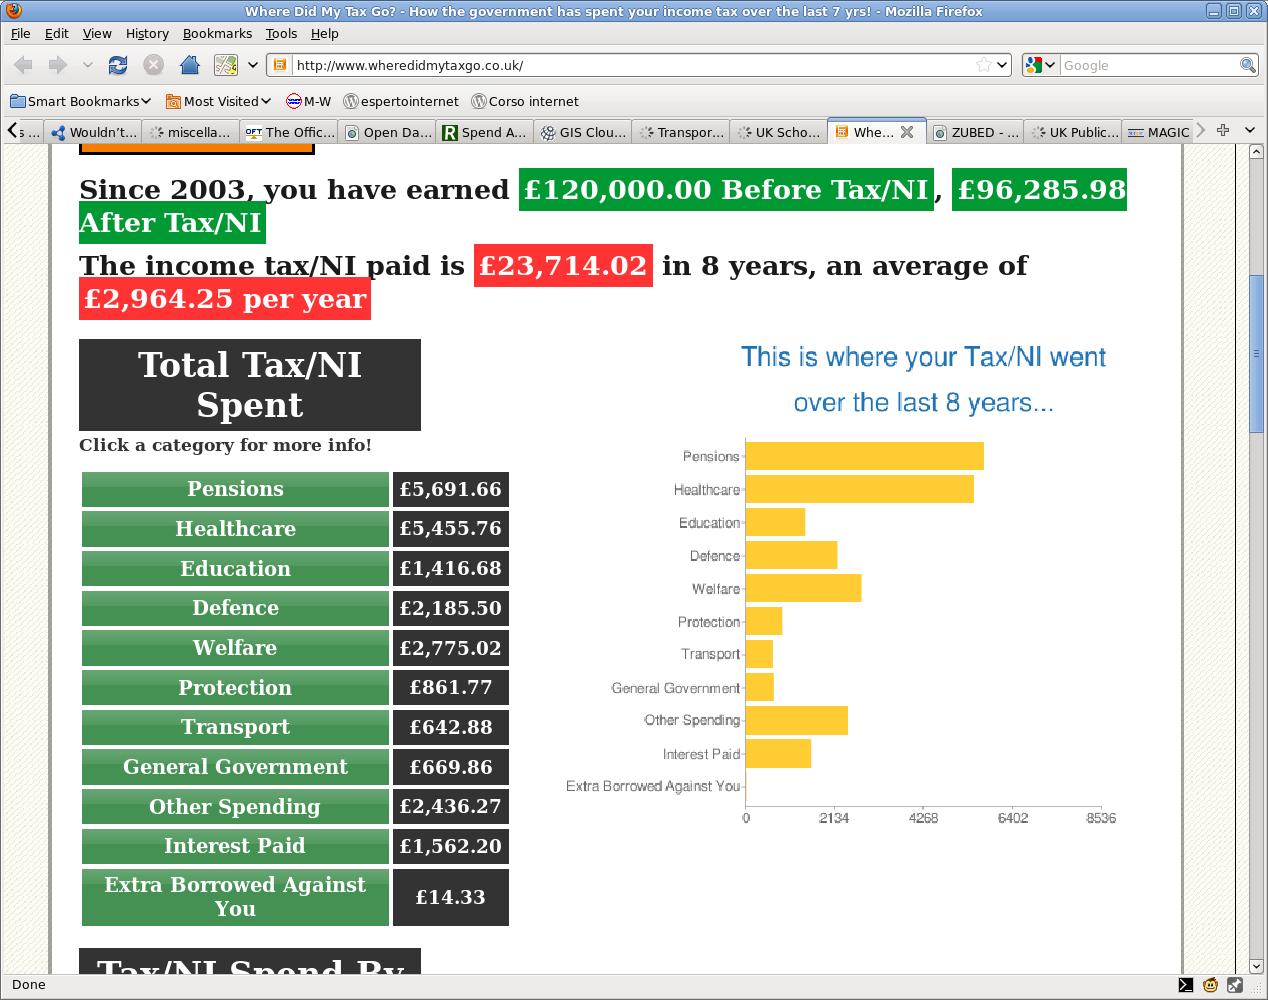
Here’s an example of “Where did my tax go” calculation.
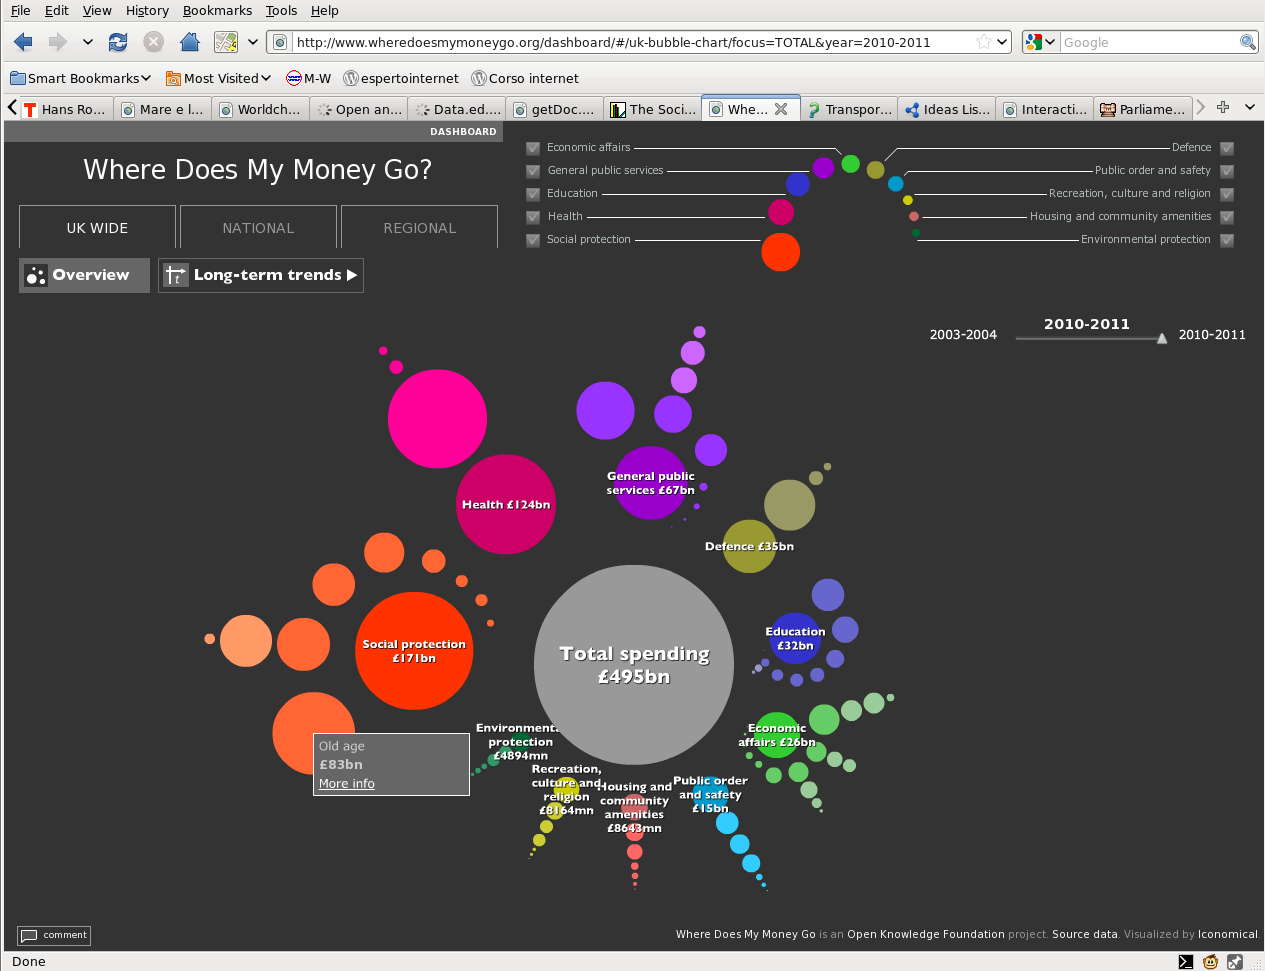
Another website offering the same services, but visualizing the same data in a different way, is Where Does My Money Go.
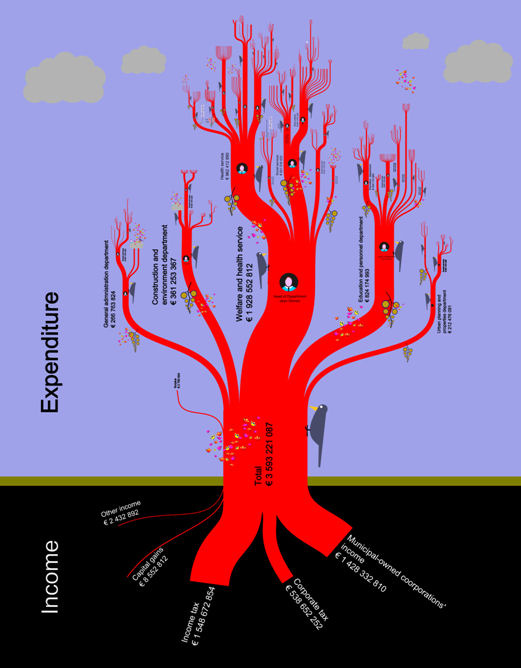
The Tax Tree shows the same kind of data, but visually combined in another different way, that may be easier to understand or simply more interesting to look at for many users:
Who writes this, why, and how to help
I am Marco Fioretti, tech writer and aspiring polymath doing human-digital research and popularization.
I do it because YOUR civil rights and the quality of YOUR life depend every year more on how software is used AROUND you.
To this end, I have already shared more than a million words on this blog, without any paywall or user tracking, and am sharing the next million through a newsletter, also without any paywall.
The more direct support I get, the more I can continue to inform for free parents, teachers, decision makers, and everybody else who should know more stuff like this. You can support me with paid subscriptions to my newsletter, donations via PayPal (mfioretti@nexaima.net) or LiberaPay, or in any of the other ways listed here.THANKS for your support!